I spent two weeks optimizing a function that accounted for 0.3% of my program’s runtime. Meanwhile, a JSON unmarshaling call that ran in a loop was eating 45% of CPU time. I just didn’t know it.
This happens more often than you’d think. We optimize based on gut feeling, not data. We assume the database query is slow. We assume the algorithm is the problem. We’re usually wrong.
pprof is Go’s profiling tool. It’s built into the runtime, requires minimal setup, and answers the question: “Where is my program actually spending time?” Not where you think it’s spending time. Where it actually is.
What pprof Does
Three main things:
- Shows where CPU time goes - Which functions are hot
- Shows where memory goes - What’s allocating and how much
- Shows where goroutines are stuck - What’s blocking
There are other profile types (block, mutex, etc.), but these three solve most problems. We’ll cover the rest in later parts.
The setup
If you’re running any kind of service, add this:
package main

import (
    "log"
    "net/http"
    _ "net/http/pprof"
)

func main() {
    go func() {
        log.Println(http.ListenAndServe("localhost:6060", nil))
    }()

    runYourApplication()
}
Three things matter here. The blank import (_ "net/http/pprof") is what registers the profiling handlers at /debug/pprof/. The pprof server runs in a goroutine so your real application runs on main. And the ListenAndServe error is logged — if port 6060 is taken, you’ll know, instead of silently losing profiling.
If you’re not running a server — say, you’re profiling a benchmark or a CLI tool — you don’t need the HTTP handlers at all. go test writes profiles directly:
go test -bench=. -cpuprofile=cpu.prof -memprofile=mem.prof
go tool pprof cpu.prof
Run your program, visit http://localhost:6060/debug/pprof/. You’ll see available profiles.
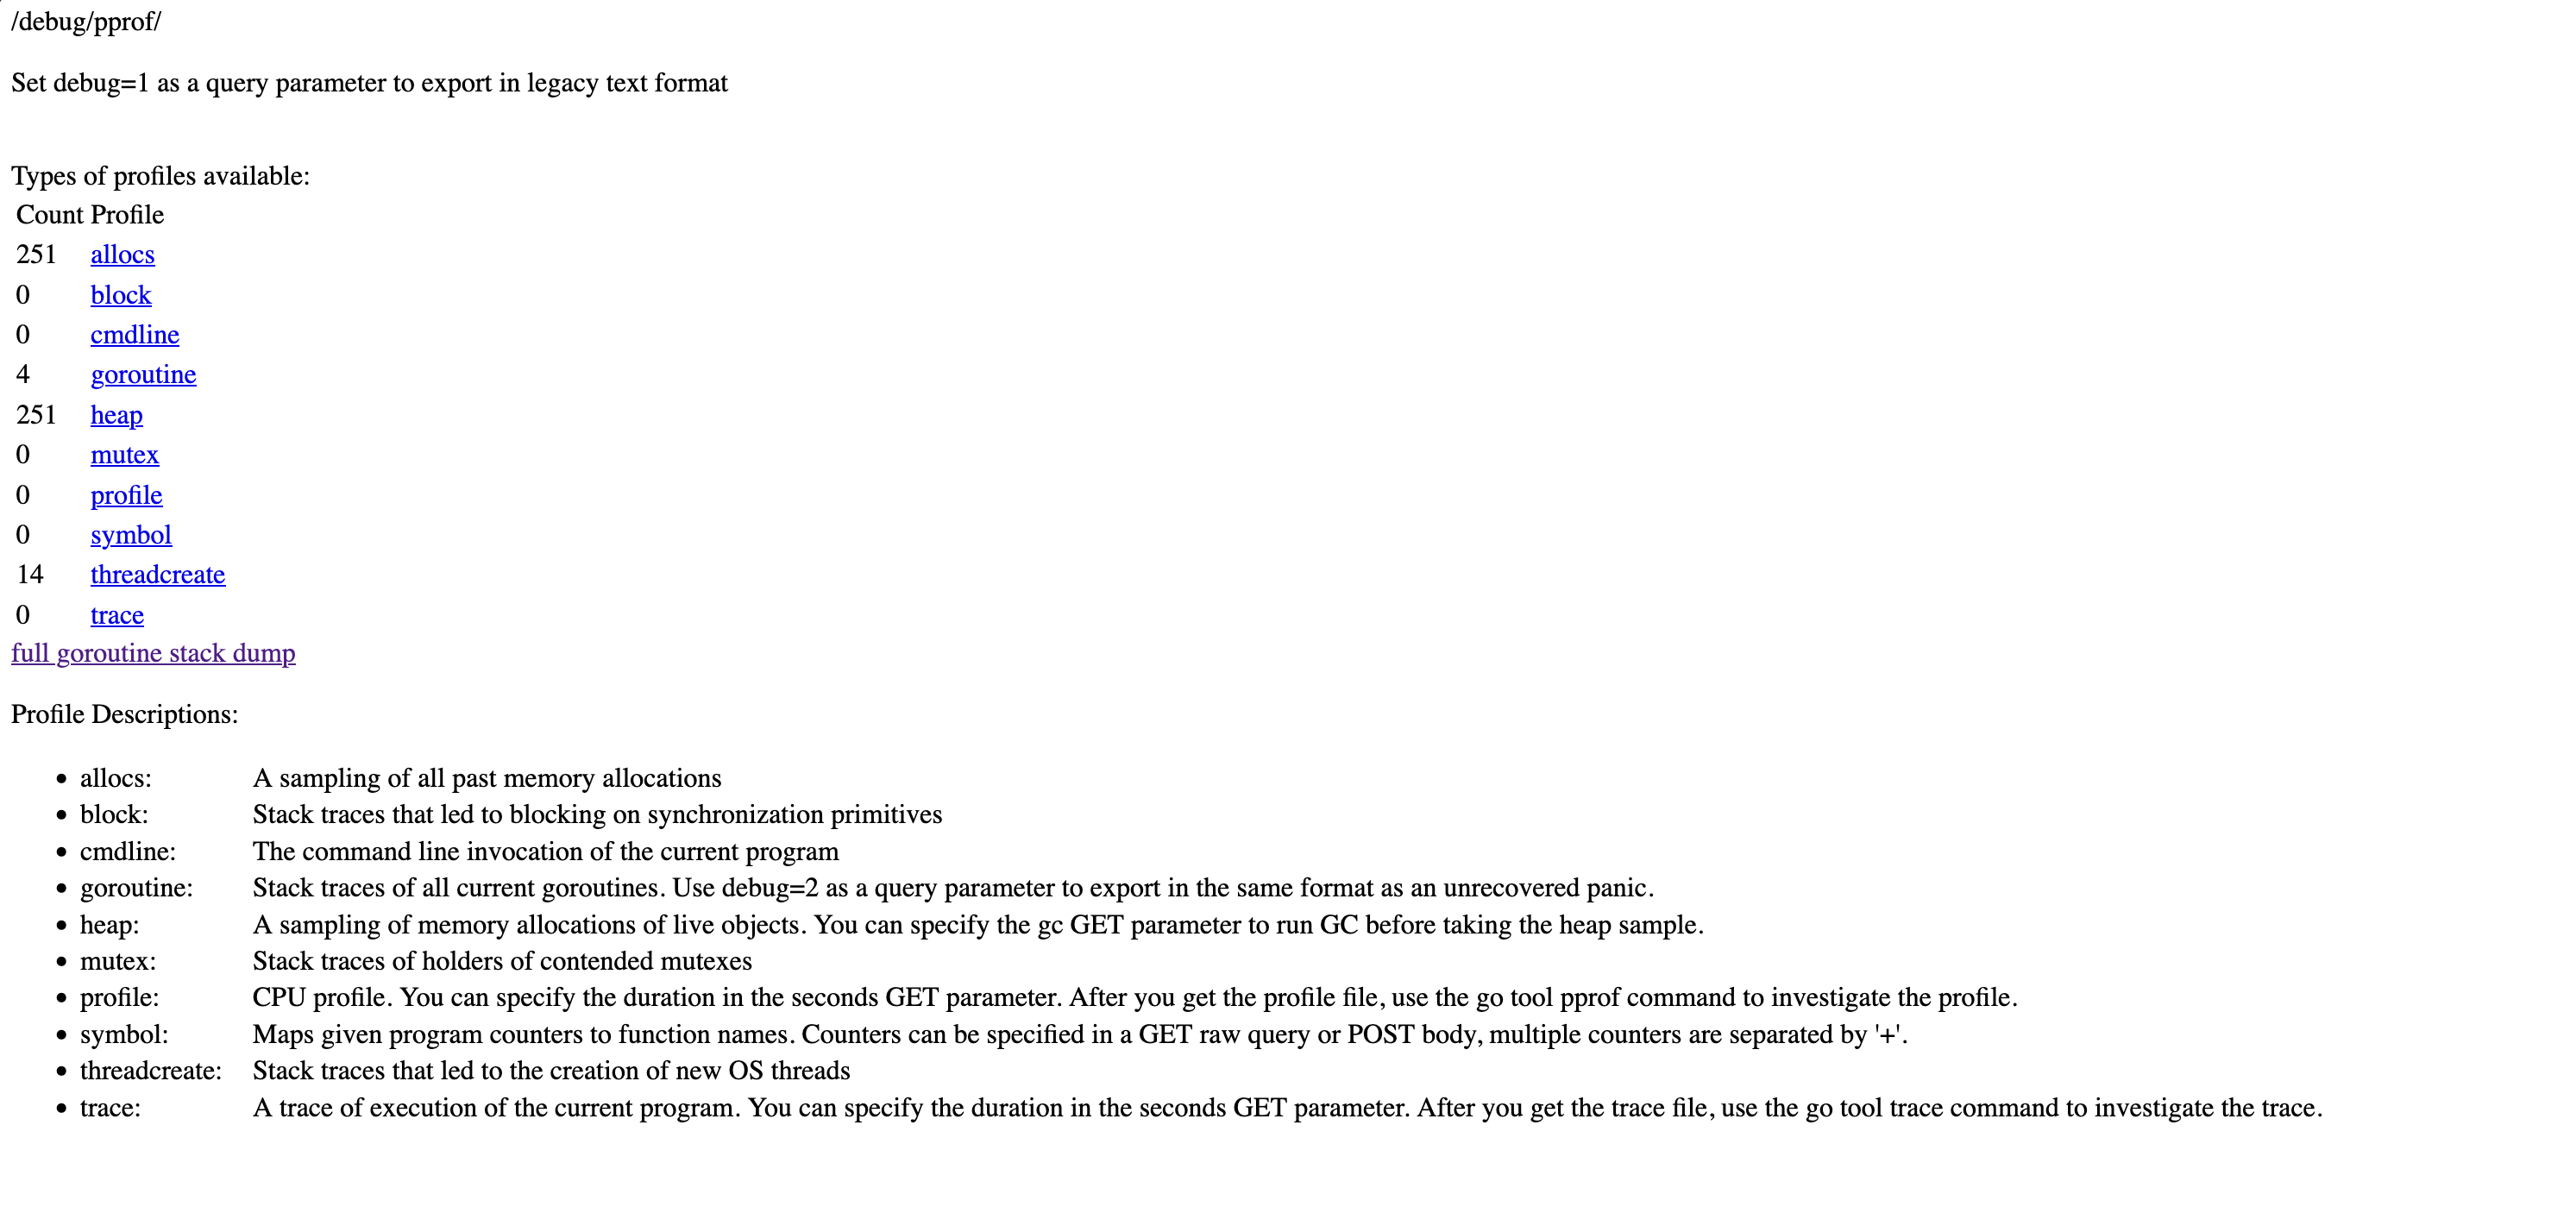
One important note: Don’t expose this to the public internet. Bind to 127.0.0.1 (as above), or put it behind auth, or run it on a separate listener bound to a private interface — never 0.0.0.0. Profiles leak information about your code structure, and generating them uses resources.
CPU Profiling
Your service is slow. Where’s the time going?
Collecting a Profile
go tool pprof http://localhost:6060/debug/pprof/profile?seconds=30
This tells your program to profile CPU usage for 30 seconds, downloads the result, and drops you into an interactive prompt.
You’ll see:
Fetching profile over HTTP from http://localhost:6060/debug/pprof/profile?seconds=30
Saved profile in /Users/you/pprof/pprof.samples.cpu.001.pb.gz
Type: cpu
Duration: 30.13s, Total samples = 27.5s (91.3%)
Entering interactive mode (type "help" for commands)
(pprof)
Reading the Profile
Type top:
(pprof) top
      flat  flat%   sum%        cum   cum%
     4.20s 15.27% 15.27%      4.85s 17.64%  runtime.scanobject
     2.80s 10.18% 25.45%      2.80s 10.18%  runtime.memmove
     1.50s  5.45% 30.91%     12.30s 44.73%  main.processRequest
     1.20s  4.36% 35.27%      3.40s 12.36%  encoding/json.Unmarshal
     0.90s  3.27% 38.55%      5.20s 18.91%  main.parseData
Two columns matter:
- flat: Time spent in the function itself
- cum: Time spent in the function plus everything it calls
Look at main.processRequest. Flat is 1.50s (5.45%) but cumulative is 12.30s (44.73%). The function itself is fast. Something it calls is slow.
Compare with runtime.scanobject. Flat is 4.20s, cumulative is 4.85s — almost all leaf work, not delegation.
This distinction matters. Optimizing processRequest directly buys you at most a few percent. The headroom is in what it calls — that’s where the cumulative 45% lives.
The Web UI
The terminal view works, but the web UI is better:
go tool pprof -http=:8080 http://localhost:6060/debug/pprof/profile?seconds=30
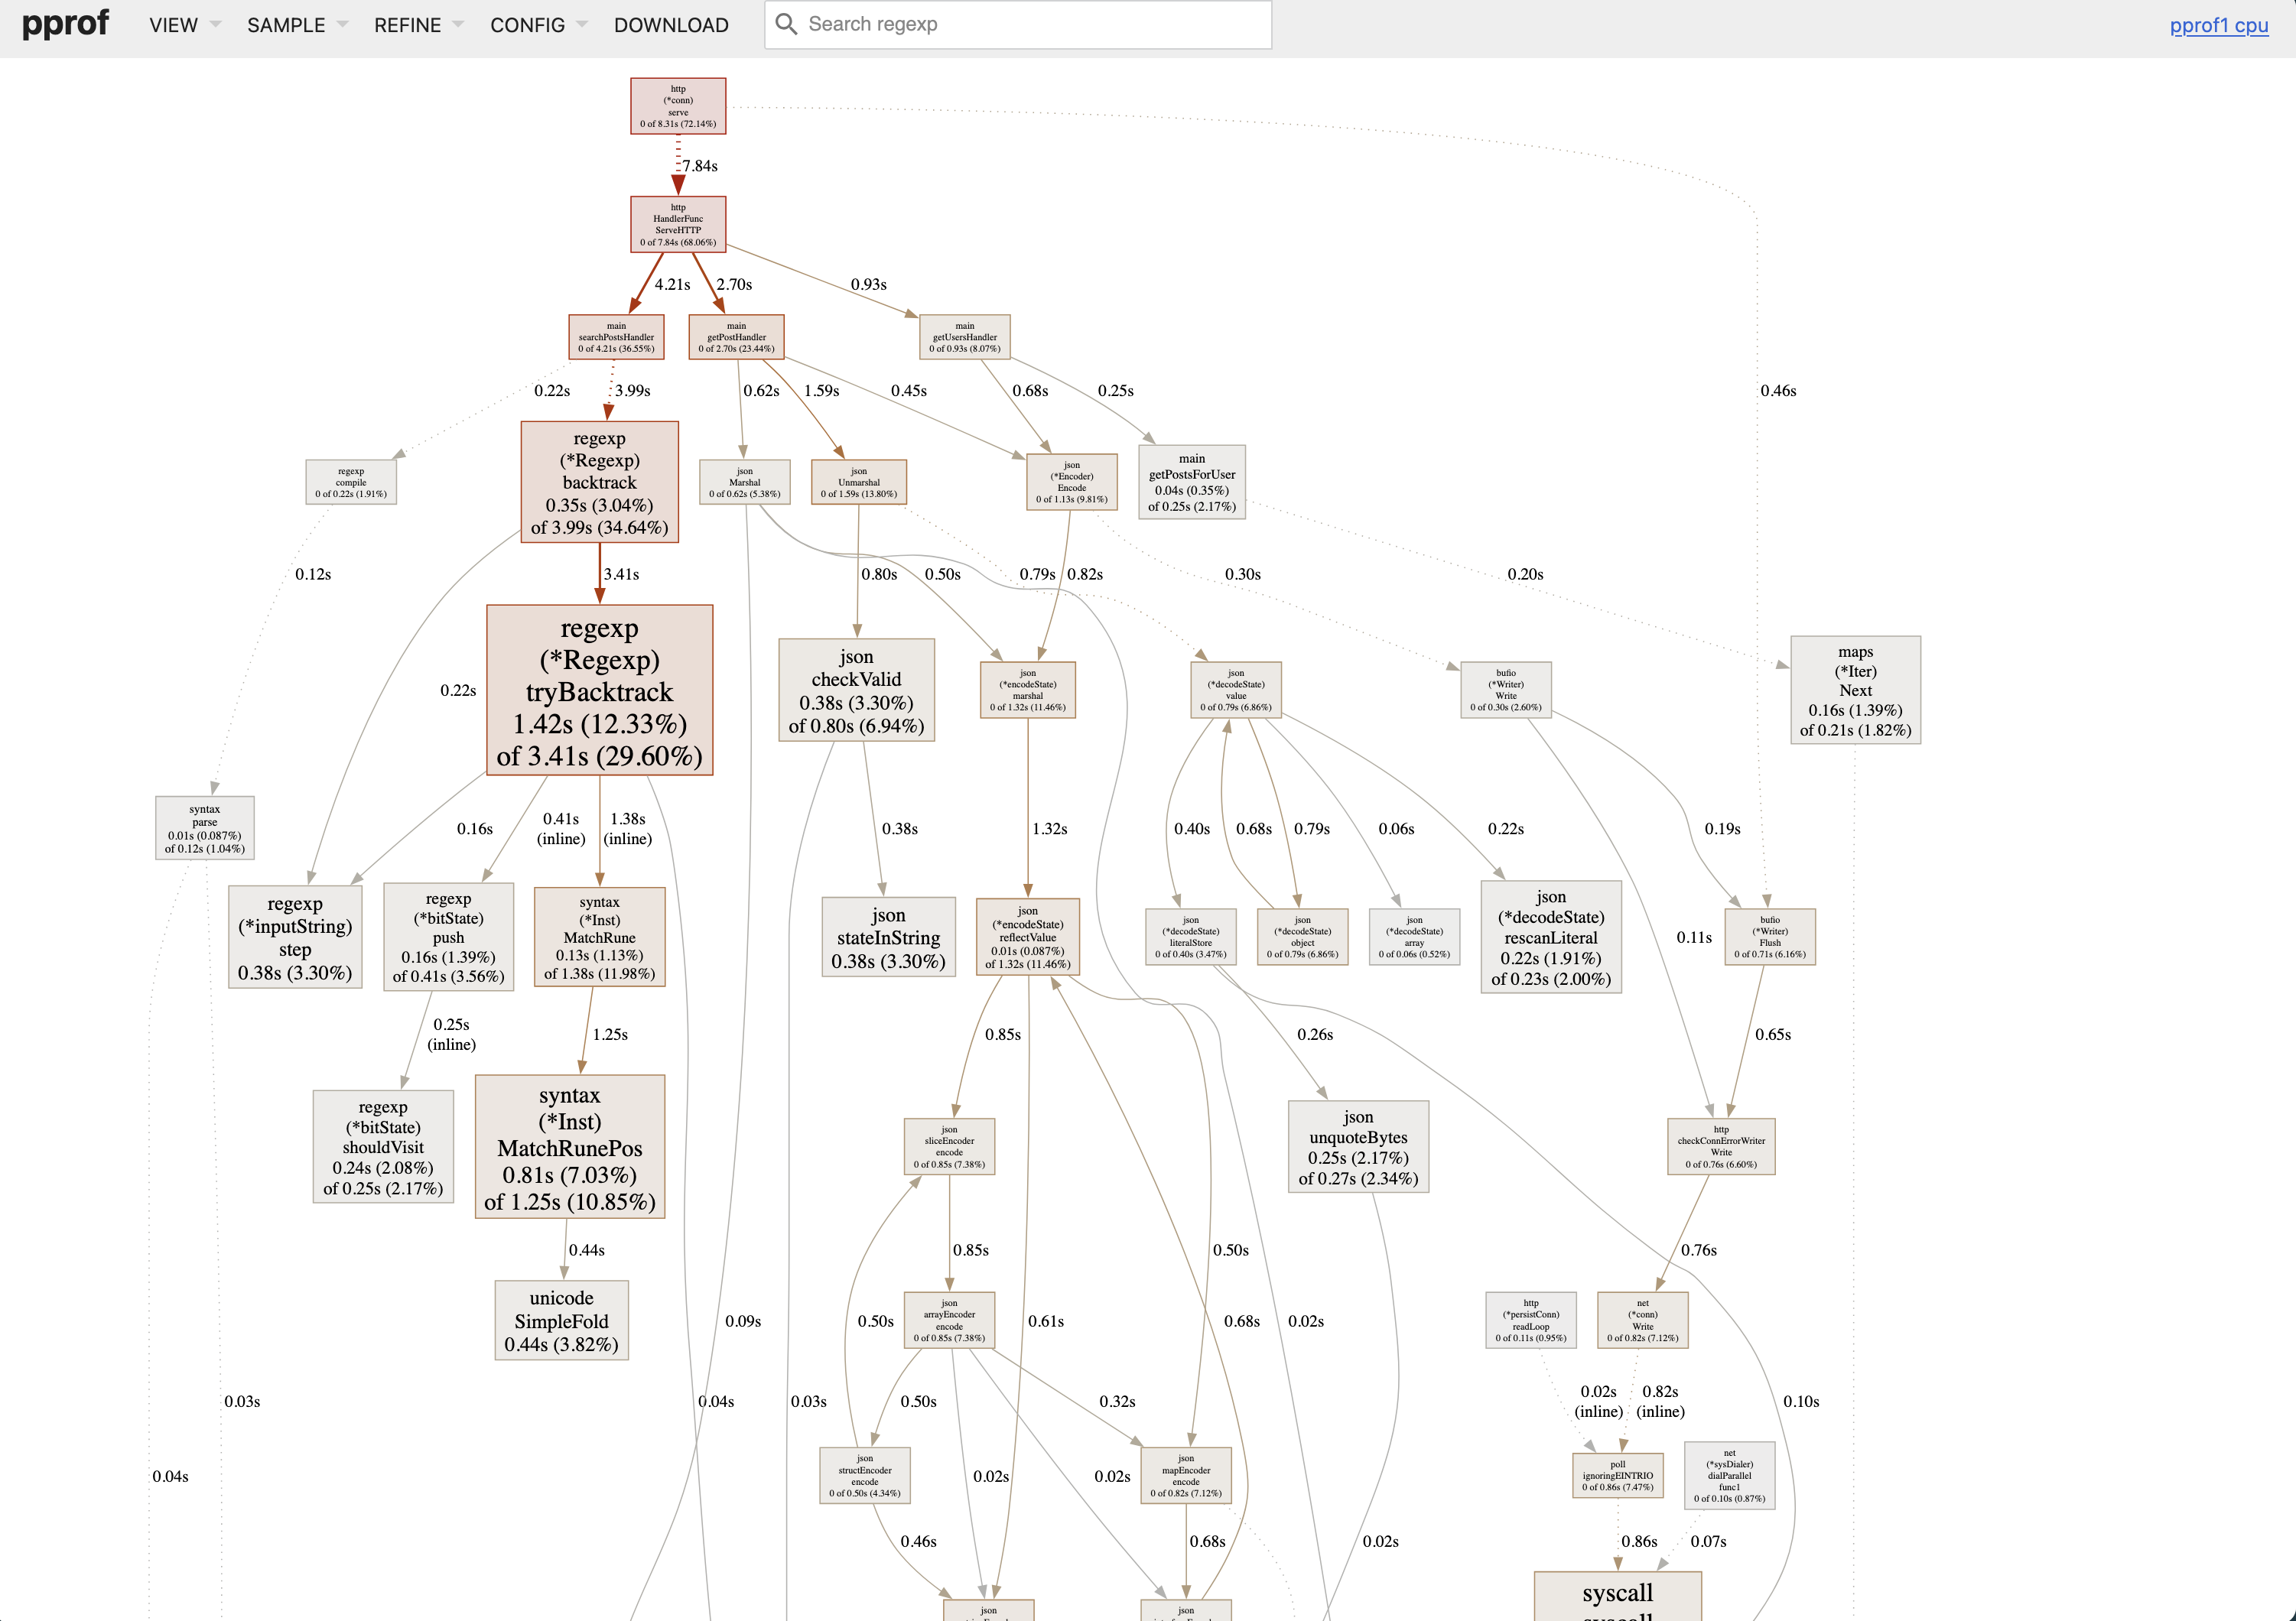
Opens your browser with multiple views. The most useful: flame graph.
Click VIEW → Flame Graph.
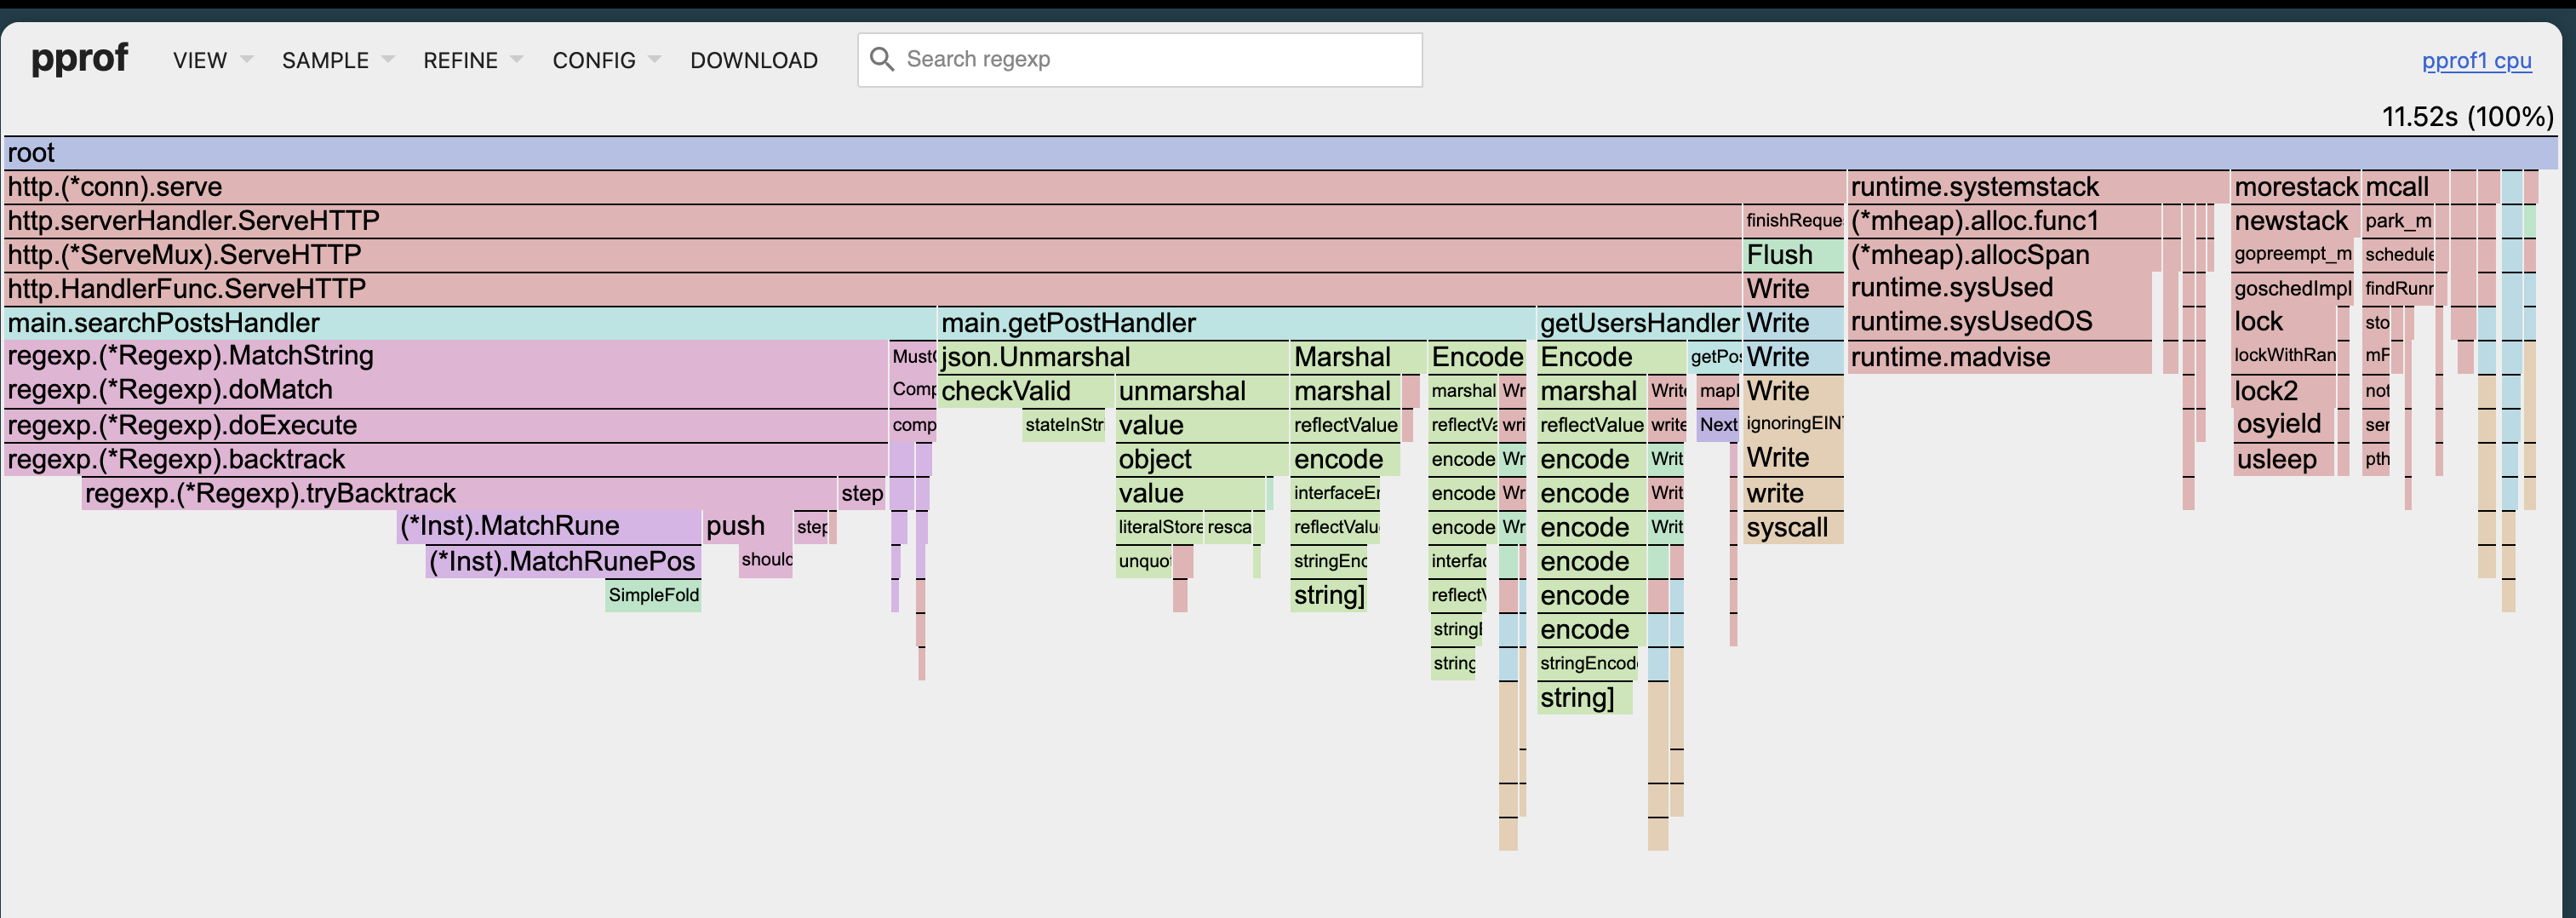
Width equals time. The wider the box, the more time spent there. You can spot hot paths immediately. No mental math.
Colors just distinguish packages. They don’t mean anything else.
What to Look For
In the flame graph or graph view:
- Wide sections in your code - Optimization targets
- Unexpected stdlib calls - Like
encoding/jsontaking 20% (maybe you’re parsing JSON in a loop?) - GC overhead - Functions starting with
runtime.related to garbage collection
Common patterns:
String concatenation in loops:
// This allocates on every iteration
result := ""
for _, item := range items {
    result += item
}

// Pre-allocate instead
var builder strings.Builder
builder.Grow(estimatedSize)
for _, item := range items {
    builder.WriteString(item)
}
JSON marshaling in hot paths:
// Called millions of times
func handler(w http.ResponseWriter, r *http.Request) {
    data := getData()
    json.Marshal(data) // Expensive
}
Regex compilation in loops:
// Recompiled every iteration
for _, line := range lines {
    re := regexp.MustCompile(`pattern`)
    re.MatchString(line)
}

// Compile once
var re = regexp.MustCompile(`pattern`)

func process(lines []string) {
    for _, line := range lines {
        re.MatchString(line)
    }
}
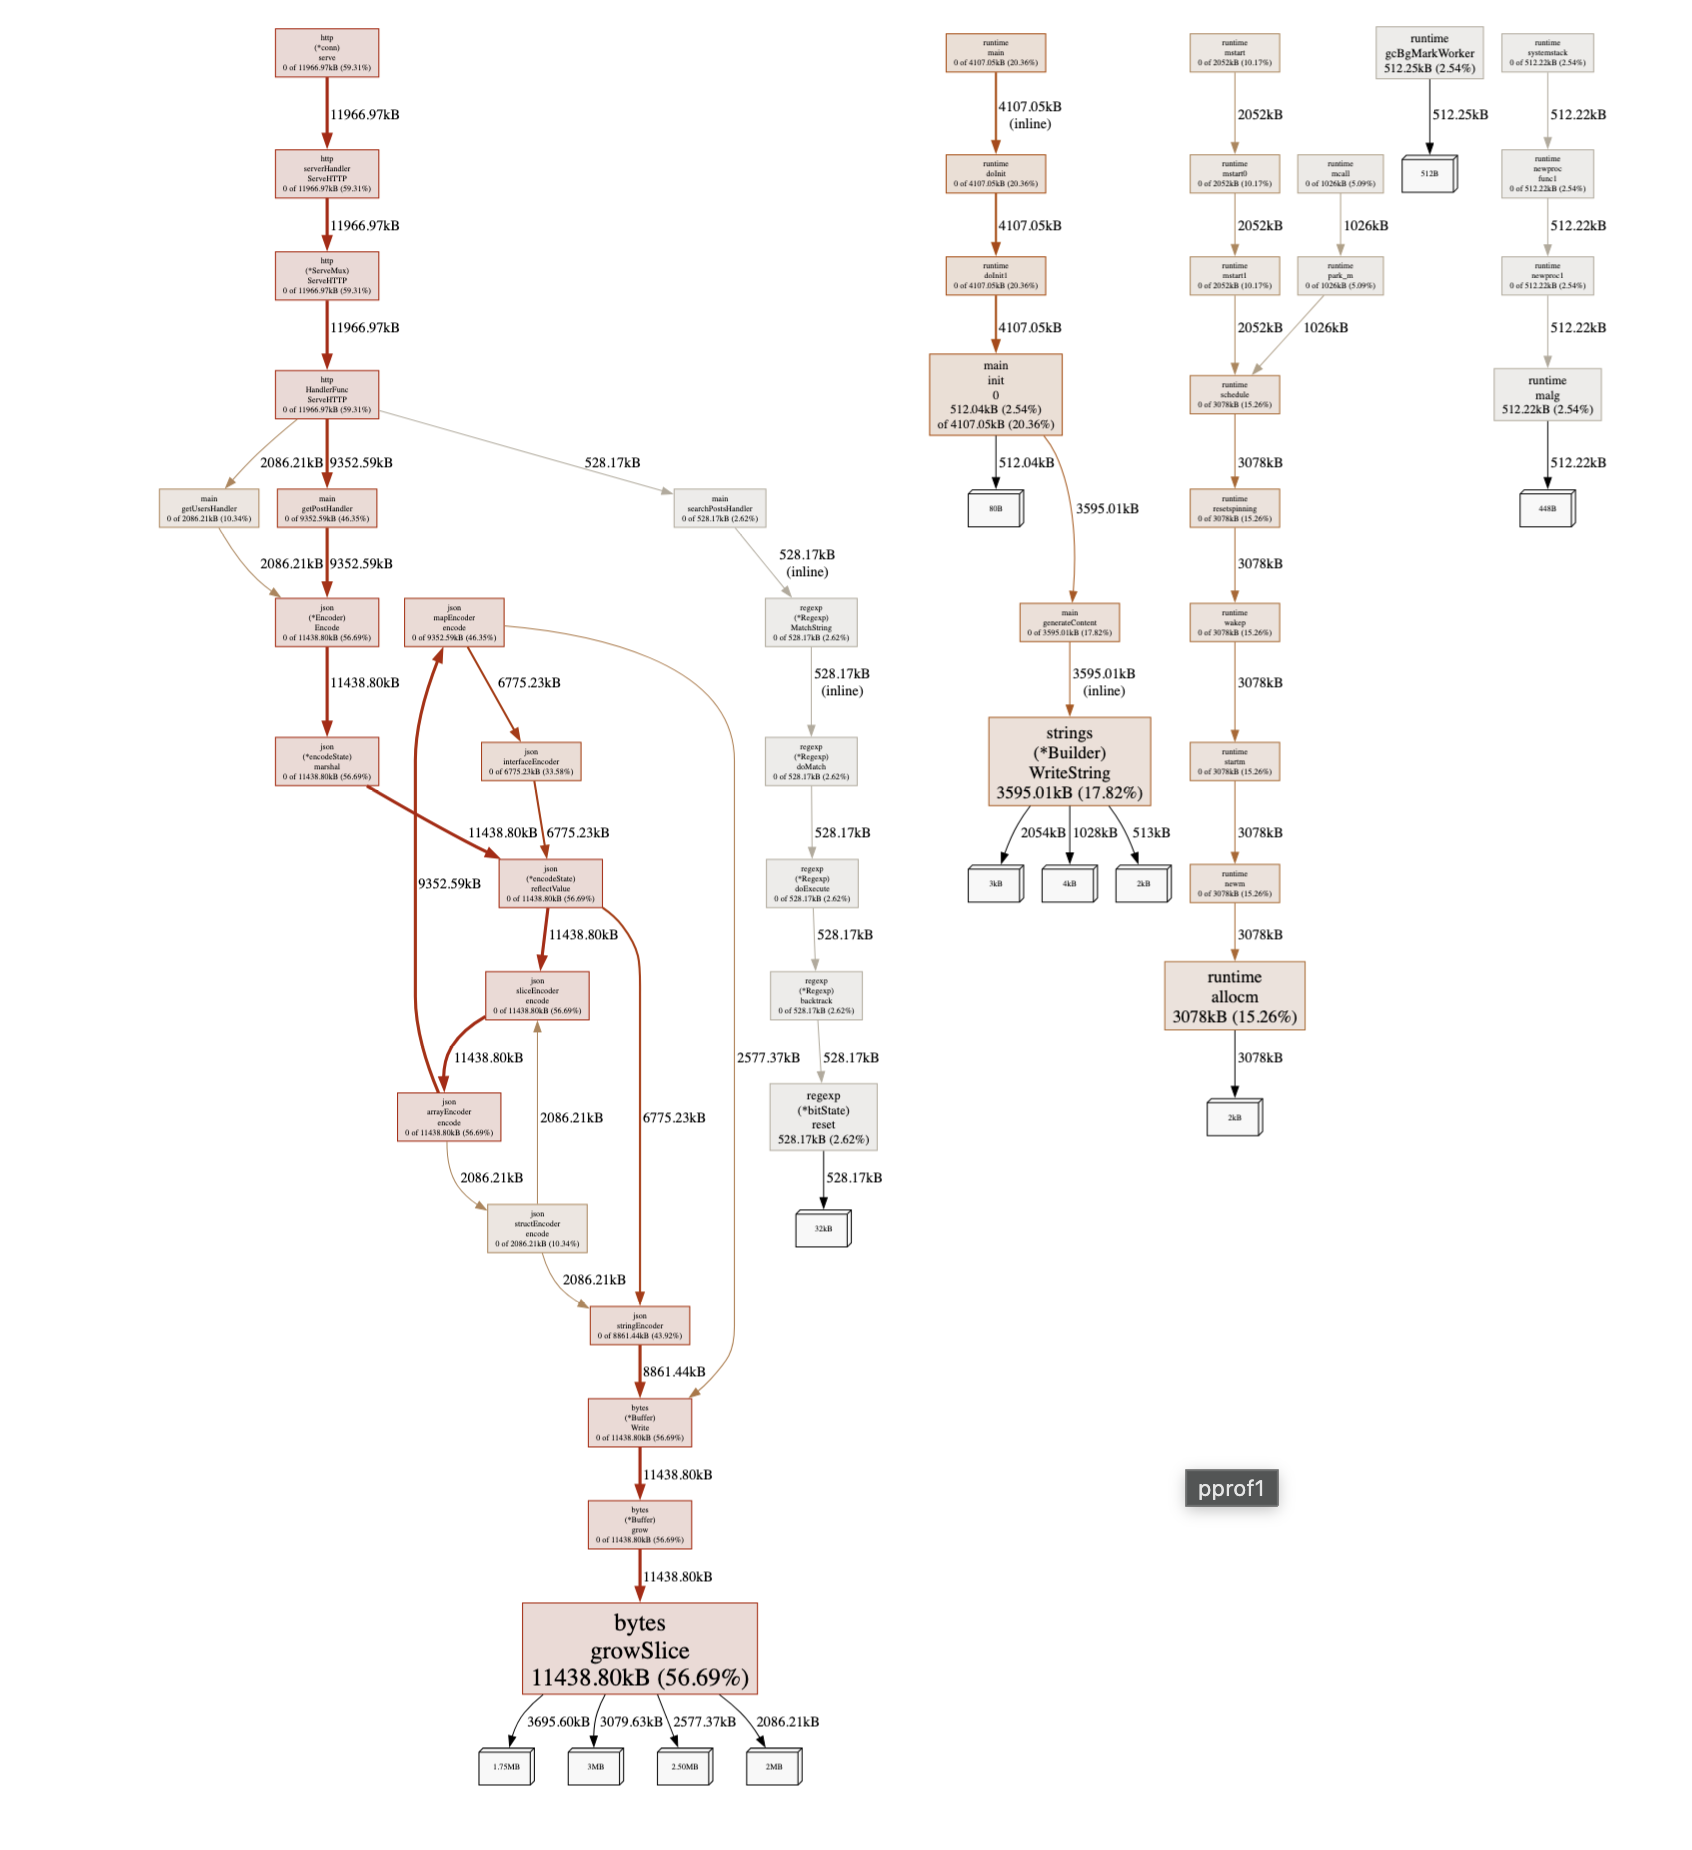
Memory Profiling
CPU is one thing. Memory is different.
Collecting a Memory Profile
go tool pprof -http=:8080 http://localhost:6060/debug/pprof/heap
Opens the web UI immediately with current heap state.
The Four Metrics
Memory profiles show four metrics. This confuses everyone initially:
- alloc_space: Total bytes allocated (even if later freed)
- alloc_objects: Total number of allocations
- inuse_space: Bytes currently allocated (not freed yet)
- inuse_objects: Objects currently allocated
Switch between them in the SAMPLE dropdown.
For finding leaks: Use inuse_space or inuse_objects
For reducing GC pressure: Use alloc_space or alloc_objects
Finding Memory Leaks
Memory leaks in Go aren’t traditional leaks. They’re usually “keeping references to things we shouldn’t.”
Real example I debugged:
var cache = make(map[string]*UserSession)

func getSession(id string) *UserSession {
    if session, ok := cache[id]; ok {
        return session
    }

    session := &UserSession{id: id}
    cache[id] = session // Never removed
    return session
}
Every session stays in the map forever. Over days, this grows to gigabytes.
To find this, take two heap profiles with time between them:
# First profile
curl http://localhost:6060/debug/pprof/heap > heap1.prof

# Wait 30 minutes
# Second profile
curl http://localhost:6060/debug/pprof/heap > heap2.prof

# Compare
go tool pprof -http=:8080 -base=heap1.prof heap2.prof
The -base flag shows the difference. Functions with memory growth appear at the top.
Reducing Allocations
High allocation rate means GC pressure. GC pressure means latency spikes.
Unnecessary conversions:
// Converts string to []byte
func process(s string) {
    data := []byte(s) // Allocation
    hash := sha256.Sum256(data)
}
Growing slices:
// Slice grows multiple times
var results []Result
for item := range items {
    results = append(results, process(item))
}

// Pre-allocate if you know the size
results := make([]Result, 0, len(items))
for item := range items {
    results = append(results, process(item))
}
Interface boxing:
// Each number boxed into interface{}
func sum(numbers []interface{}) int {
    total := 0
    for _, n := range numbers {
        total += n.(int)
    }
    return total
}

// Use concrete types or generics
func sum(numbers []int) int {
    total := 0
    for _, n := range numbers {
        total += n
    }
    return total
}
Goroutine Profiling
Your program has 50,000 goroutines. Normal? Let’s check.
go tool pprof -http=:8080 http://localhost:6060/debug/pprof/goroutine
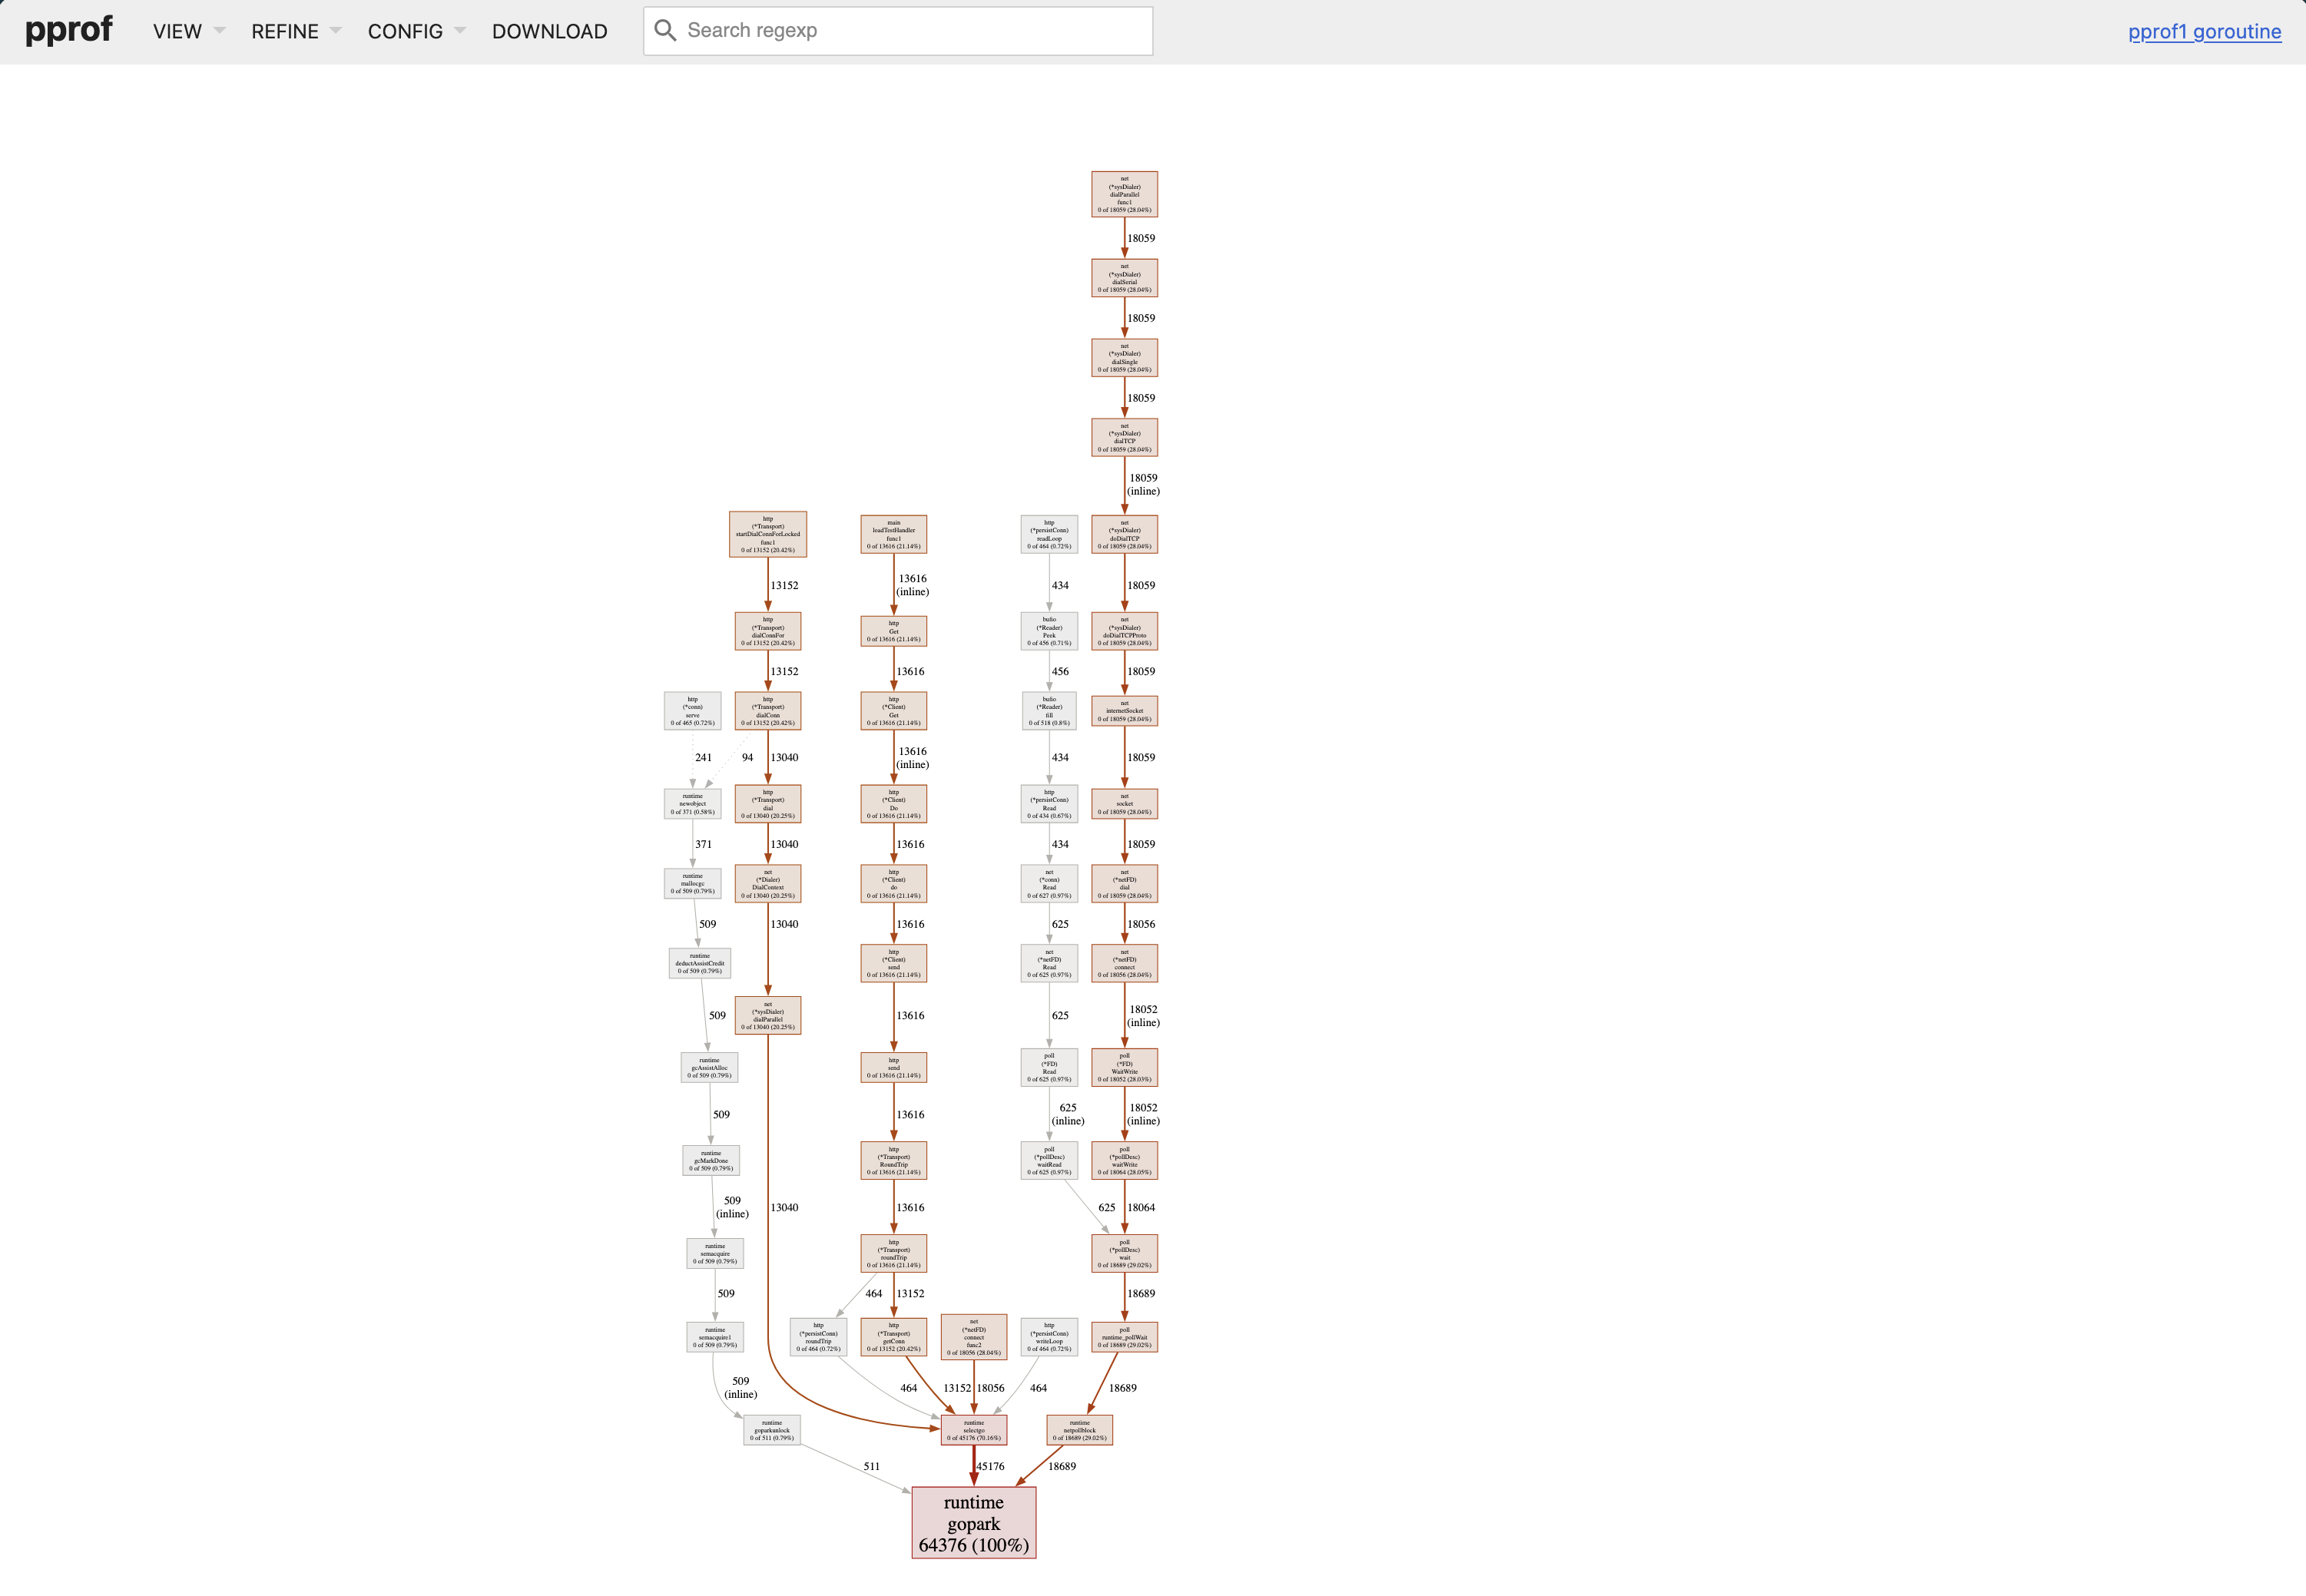
top on a goroutine profile counts goroutines by where they’re stuck. A real bug looks like this:
(pprof) top
       flat  flat%   sum%        cum   cum%
      48721 97.44% 97.44%      48721 97.44%  net/http.(*Transport).roundTrip
        612  1.22% 98.67%        612  1.22%  runtime.gopark
         ...
48,721 goroutines parked in the same roundTrip call means that many in-flight HTTP requests are waiting for a response. That’s almost never normal — it’s a missing timeout, a hung downstream, or a leak on the call site.
Common issues:
HTTP client without timeout:
// No timeout, goroutine can block forever
resp, err := http.Get(url)

// With timeout
client := &http.Client{Timeout: 10 * time.Second}
resp, err := client.Get(url)
Channel without receiver:
// If no one reads, sender blocks forever
func worker() {
    ch := make(chan int)
    go func() {
        ch <- 42 // Blocks
    }()
}

// Buffered or ensure receiver
ch := make(chan int, 1)
go func() {
    ch <- 42
}()
Missing WaitGroup.Done():
var wg sync.WaitGroup
wg.Add(1)
go func() {
    doWork()
    // Forgot wg.Done()
}()
wg.Wait() // Waits forever
If you see thousands of goroutines stuck in the same place, that’s your bug.
Real Example
Last year I had an API endpoint with 2-second p99 response times.
Collected CPU Profile
go tool pprof -http=:8080 http://localhost:6060/debug/pprof/profile?seconds=30
top made the problem obvious:
(pprof) top10
      flat  flat%   sum%        cum   cum%
    11.20s 39.86% 39.86%     12.10s 43.06%  encoding/json.(*encodeState).marshal
     3.40s 12.10% 51.96%      3.40s 12.10%  runtime.scanobject
     2.10s  7.47% 59.43%     14.30s 50.89%  main.getUsers
     1.80s  6.41% 65.84%      1.80s  6.41%  runtime.memmove
     1.20s  4.27% 70.11%      1.20s  4.27%  syscall.syscall
40% of CPU in JSON encoding for a database listing endpoint is a smell, not a bug. The flame graph confirmed it — one fat block under getUsers labelled json.Marshal.
The code:
func getUsers(w http.ResponseWriter, r *http.Request) {
    users := db.GetAllUsers()

    for i := range users {
        users[i].Posts = db.GetUserPosts(users[i].ID)
        users[i].Comments = db.GetUserComments(users[i].ID)
    }

    json.NewEncoder(w).Encode(users)
}
Two problems:
- N+1 queries
- Marshaling huge objects
Fixed It
func getUsers(w http.ResponseWriter, r *http.Request) {
    users := db.GetAllUsers()

    userIDs := make([]int, len(users))
    for i, u := range users {
        userIDs[i] = u.ID
    }

    postsMap := db.GetPostsForUsers(userIDs)
    commentsMap := db.GetCommentsForUsers(userIDs)

    for i := range users {
        users[i].Posts = postsMap[users[i].ID]
        users[i].Comments = commentsMap[users[i].ID]
    }

    json.NewEncoder(w).Encode(users)
}
Result: 2s → 200ms.
But heap profile showed 50MB allocated per request. Each User had full Posts and Comments. For a listing endpoint, we only needed counts.
Final version:
type UserListItem struct {
    ID           int    `json:"id"`
    Name         string `json:"name"`
    PostCount    int    `json:"post_count"`
    CommentCount int    `json:"comment_count"`
}

func getUsers(w http.ResponseWriter, r *http.Request) {
    users := db.GetUserSummaries()
    json.NewEncoder(w).Encode(users)
}
Result: 200ms → 50ms, 50MB → 500KB per request.
The Process
How I use pprof for any performance issue:
- Reproduce the problem
- Profile while it’s happening (30-60 seconds for CPU)
- Look at flame graph - find wide sections
- Check if it’s your code or stdlib/runtime
- Fix the most obvious thing
- Profile again with
-baseto compare - Repeat
For memory:
- Is it a leak or just high usage?
- If leak: compare two profiles with
-base - If high usage: look at
alloc_spacefor hotspots - Fix allocations or add limits
Common Mistakes
Profiling a debug build: If you’ve passed -gcflags='all=-N -l' (typically because you’re attaching a debugger), optimizations and inlining are off and the profile won’t reflect production behavior. Both go build and go run produce optimized binaries by default — the gotcha is the debug flags, not the command.
Profile duration too short: 30 seconds is a reasonable default for CPU. Shorter profiles are noisy; longer profiles are quieter, especially for low-frequency or sub-second issues.
Profiling the wrong thing: If slow under load, profile under load. Not an idle service.
Optimizing flat instead of cumulative: High flat means the function itself is slow. High cumulative means something it calls is slow.
Not comparing before/after: Keep the old profile. Use -base to verify your changes worked.
When pprof Isn’t Enough
pprof is great for CPU and memory, but doesn’t show:
- I/O wait time - pprof shows on-CPU time, not waiting
- Lock contention - use block and mutex profiles (covered later)
- GC pauses - use
go tool trace - System call latency - pprof shows syscalls but not their duration
For those cases, you need other tools.
What’s Next
This covers the basics:
- CPU profiling (where time goes)
- Heap profiling (where memory goes)
- Goroutine profiling (where goroutines are stuck)
In the next parts:
- Part 2: CPU Profiling Deep Dive: Understanding flat vs cumulative time, reading flame graphs, and finding real bottlenecks
- Part 3: Memory profiling internals, leak detection patterns
- Part 4: Block and mutex profiling, finding contention
- Part 5: Production profiling, continuous profiling
But this article solves 90% of problems. Master this first.
Final Thought
pprof should be your first tool, not your last resort. When something’s slow, don’t guess. Profile. Look at data. Fix what the data shows.
I’ve wasted too much time optimizing code that didn’t matter while the real bottleneck sat in some innocent-looking function that ran a million times per second.
Measure, then optimize.